Tag Archives: threads

Producer and Consumer Problem


Self explanatory Producer and Consumer problem

Producer.java

package com.producer;

import java.util.ArrayList;

import java.util.Random;

public class Producer implements Runnable{

//Engine Batch ID reference

ArrayList engineList;

//Engine No is stored here

String str;

//Assigning the BATCH ID reference

public Producer(ArrayList engineList) {

this.engineList = engineList;

}

/*

* Produce Engines

*/

public void produce(){

//Random number for engine number

str = ""+Math.abs(new Random(System.currentTimeMillis()).nextLong());

//Only one thread can enter the BATCH for any operation

synchronized (engineList) {

//Add the Engine to the batch

engineList.add(str);

//Notify all other threads that the new engine is added to the BATCH

engineList.notifyAll();

}

//Print Engine Number

System.out.println("Produced :: ENGINE CHASIS NO ["+ str + "]");

}

@Override

public void run() {

System.out.println("Production started");

//10 Engine is to be produced

for(int i=0;i<10;i++){

try {

//Produce the engine

this.produce();

//Sleep for 2 seconds for the next operation

Thread.sleep(2000);

} catch (InterruptedException e) {

// TODO Auto-generated catch block

e.printStackTrace();

}

}

}

}

Consumer.java


package com.producer;

import java.util.ArrayList;

public class Consumer extends Thread{

//Engine Batch ID reference

ArrayList<String> engineList;

//Engine No is stored here

String str;

//Assigning the BATCH ID reference

public Consumer(ArrayList<String> engineList) {

this.engineList = engineList;

}

/*

* Consume Engines from the BATCH

*/

public  void consume(int index) throws InterruptedException{

//Only one thread can enter the BATCH for any operation

synchronized (engineList) {

//if the Batch has no engines

while(engineList.size() == 0){

//then wait for some time until you get a new engine to consume

engineList.wait();

}

//If the engine is deployed to the BATCH

if(engineList.size() >= 0){

//The consume the engine from the respective position

str = engineList.get(index);

}

}

//Print Engine Number that it has been consumed

System.out.println("Consumed :: -------> ENGINE CHASIS NO ["+ str + "]" );

}

@Override

public void run() {

//10 Engine has to be consumed

for(int i=0;i<10;i++){

try {

//Produce the engine

this.consume(i);

//Sleep for 3 seconds for the next operation

Thread.sleep(3000);

} catch (InterruptedException e) {

// TODO Auto-generated catch block

e.printStackTrace();

}

}

}

}

Main.java


package com.producer;

import java.util.ArrayList;

public class Main {

public static void main(String[] args) throws InterruptedException {

//ArrayList to store the produced engines - BATCH

ArrayList<String> engine = new ArrayList<String>();

//Producer taking the engine BATCH ID Reference

Producer producer = new Producer(engine);

//Consumer taking the reference of the engine BATCH ID Reference

Consumer consumer = new Consumer(engine);

//Threads

Thread prodThread = new Thread(producer);

Thread conThread = new Thread(consumer);

//Starting the production

prodThread.start();

//Start Consumption

conThread.start();

}

}

jrcmd – useful commands


JRockit jrcmd command is very useful for debugging issues i nthe JVM

usage:


 jrcmd


the processid is 5176 here in this example


 jrcmd 5176 help

The following commands are available:

 kill_management_server

 start_management_server

 print_object_summary

 memleakserver

 print_class_summary

 print_codeblocks

 dump_codelayout

 dump_codelist

 dump_codemap

 print_codegenlist

 print_vm_state

 print_utf8pool

 check_flightrecording

 dump_flightrecording

 stop_flightrecording

 start_flightrecording

 print_properties

 hprofdump

 print_threads

 datadump_request

 runsystemgc

 runfinalization

 heap_diagnostics

 oom_diagnostics

 print_exceptions

 version

 timestamp

 command_line

 sanity

 verbosity

 set_filename

 help

 print_memusage

 set_vmflag

 list_vmflags

 For more information about a specific command use 'help <command>'.

 Parameters to commands are optional unless otherwise stated.


 jrcmd 5176 print_object_summary


5176:

--------- Detailed Heap Statistics: ---------

43.4% 3565k    33273  +3565k [C

9.8% 802k    34241   +802k java/lang/String

7.9% 645k     5906   +645k java/lang/Class

5.1% 419k     1447   +419k [I

3.9% 316k    13498   +316k java/util/HashMap$Entry

...

8206kB total ---

--------- End of Detailed Heap Statistics ---


 jrcmd 5176 print_class_summary


5176:

- Class Summary Information starts here

class java/lang/Object

*class jrockit/vm/Memset

*class jrockit/vm/StringMaker

*class org/eclipse/swt/internal/win32/GCP_RESULTS

*class org/eclipse/swt/internal/win32/SCRIPT_FONTPROPERTIES

*class org/eclipse/swt/internal/win32/EXTLOGFONTW

*class org/eclipse/swt/graphics/TextLayout$1$MetaFileEnumProc

.....


 jrcmd 5176 print_codeblocks


5176:

Codeblock type=0 start= 0x04750000 end=0x04760000 top=0x04750540 freelist=0

Codeblock type=2 start= 0x04770000 end=0x04790000 top=0x0478FFA3 freelist=4264

Codeblock type=2 start= 0x04DD0000 end=0x04DF0000 top=0x04DEFFEB freelist=421

Codeblock type=2 start= 0x05170000 end=0x05190000 top=0x0518FFF0 freelist=466

....


 jrcmd 5176 print_codegenlist


5176:

JIT queue length: 0

Opt queue length: 0


 jrcmd 5176 print_vm_state

 
</pre>
CPU          : Intel Core 2 SSE SSE2 SSE3 SSSE3 Core Intel64

Number CPUs  : 2

Tot Phys Mem : 2136891392 (2037 MB)

OS version   : Microsoft Windows XP version 5.1 Service Pack 3 (Build 2600) (32-bit)

Thread System: Windows Threads

Java locking : Lazy unlocking enabled (class banning) (transfer banning)

State        : JVM is running

Command Line : -Denv.class.path=.;C:\Program Files\Java\jre6\lib\ext\QTJava.zip -Dapplication.home=C:\Program Files\Java\jrockit-jdk1.6.0_20-R28.1.0-4.0.1 -client -Dsun.java.launcher=SUN_STANDARD com.jrockit.mc.rcp.start.MCMain

...

GC Strategy  : Mode: pausetime, with strategy: singleconcon (basic strategy: singleconcon)

GC Status    : OC is not running. Last finished OC was OC#41.

Heap         : 0x10040000 - 0x12E78000  (Size: 46 MB)

Heap History : OC#14      - 0x11040000  (16 MB -> 19 MB; +3280 KB)

: OC#18      - 0x11374000  (19 MB -> 24 MB; +4400 KB)

: OC#21      - 0x117C0000  (24 MB -> 27 MB; +3320 KB)

: OC#26      - 0x11AFE000  (27 MB -> 32 MB; +5480 KB)

: OC#27      - 0x12058000  (32 MB -> 39 MB; +6576 KB)

: OC#28      - 0x126C4000  (39 MB -> 46 MB; +7888 KB)

Compaction   : (no compaction area)

Allocation   : TLA-min: 2048, TLA-preferred: 16384 TLA-waste limit: 2048

CompRefs     : References are 32-bit.

Loaded modules:

00400000-0043afff  C:\Program Files\Java\jrockit-jdk1.6.0_20-R28.1.0-4.0.1\bin\jrmc.exe

7c900000-7c9b1fff  C:\WINDOWS\system32\ntdll.dll

....


 jrcmd 5176 print_properties


5176:

=== Initial Java properties: ===

java.vm.specification.name=Java Virtual Machine Specification

java.vm.vendor.url.bug=http://download.oracle.com/docs/cd/E15289_01/go2troubleshooting.html

java.home=C:\Program Files\Java\jrockit-jdk1.6.0_20-R28.1.0-4.0.1\jre

java.vm.vendor.url=http://www.oracle.com/

java.vm.specification.version=1.0

java.vm.info=compiled mode

=== End Initial Java properties ===

=== VM properties: ===

jrockit.vm=C:\Program Files\Java\jrockit-jdk1.6.0_20-R28.1.0-4.0.1\jre\bin\jrockit\jvm.dll

jrockit.vm.dir=C:\Program Files\Java\jrockit-jdk1.6.0_20-R28.1.0-4.0.1\jre\bin\jrockit

=== End VM properties ===

=== Current Java properties: ===

Could not find fields=== End Current Java properties ===


 jrcmd 5176 print_threads


5176:

===== FULL THREAD DUMP ===============

Thu Jan 27 11:27:48 2011

Oracle JRockit(R) R28.1.0-123-138454-1.6.0_20-20101014-1351-windows-ia32

"Main Thread" id=1 idx=0x4 tid=3836 prio=6 alive, in native

at org/eclipse/swt/internal/win32/OS.WaitMessage()Z(Native Method)

at org/eclipse/swt/widgets/Display.sleep(Display.java:4281)

...

-- end of trace

"(Signal Handler)" id=2 idx=0x8 tid=4692 prio=5 alive, native_blocked, daemon

"(OC Main Thread)" id=3 idx=0xc tid=3512 prio=5 alive, native_waiting, daemon

..

-- end of trace

"Reference Handler" id=9 idx=0x2c tid=5472 prio=10 alive, native_waiting, daemon

at java/lang/ref/Reference.waitForActivatedQueue(J)Ljava/lang/ref/Reference;(Native Method)

..

-- end of trace

"(Sensor Event Thread)" id=10 idx=0x30 tid=2724 prio=5 alive, native_blocked, daemon

"VM JFR Buffer Thread" id=11 idx=0x34 tid=5912 prio=5 alive, in native, daemon

"State Data Manager" id=13 idx=0x38 tid=5732 prio=5 alive, sleeping, native_waiting, daemon

..

-- end of trace

"Start Level Event Dispatcher" id=14 idx=0x3c tid=5644 prio=5 alive, waiting, native_blocked, daemon

-- Waiting for notification on: org/eclipse/osgi/framework/eventmgr/EventManager$EventThread@0x107D7B48[fat lock]

..

-- end of trace

"Framework Event Dispatcher" id=15 idx=0x40 tid=4640 prio=5 alive, waiting, native_blocked, daemon

-- Waiting for notification on: org/eclipse/osgi/framework/eventmgr/EventManager$EventThread@0x10E1A6D0[fat lock]

...

-- end of trace

"[RJMX] JDP Client" id=17 idx=0x44 tid=5596 prio=5 alive, in native

at java/net/PlainDatagramSocketImpl.receive0(Ljava/net/DatagramPacket;)V(Native Method)

^-- Holding lock: java/net/PlainDatagramSocketImpl@0x10988A80[recursive]

..

-- end of trace

"Java2D Disposer" id=19 idx=0x4c tid=4352 prio=10 alive, waiting, native_blocked, daemon

-- Waiting for notification on: java/lang/ref/ReferenceQueue$Lock@0x10D0EB30[fat lock]

..

-- end of trace

"AWT-Windows" id=21 idx=0x54 tid=3088 prio=6 alive, in native, daemon

at sun/awt/windows/WToolkit.eventLoop()V(Native Method)

..

-- end of trace

"JMAPI event thread" id=27 idx=0x68 tid=5232 prio=5 alive, in native, daemon

"JFR request timer" id=28 idx=0x6c tid=6056 prio=6 alive, waiting, native_blocked, daemon

-- Waiting for notification on: java/util/TaskQueue@0x1008DCE0[fat lock]

at jrockit/vm/Threads.waitForNotifySignal(JLjava/lang/Object;)Z(Native Method)

...

-- end of trace

"Worker-0" id=30 idx=0x70 tid=252 prio=5 alive, waiting, native_blocked

-- Waiting for notification on: org/eclipse/core/internal/jobs/WorkerPool@0x10DD48A0[fat lock]

at jrockit/vm/Threads.waitForNotifySignal(JLjava/lang/Object;)Z(Native Method)

...

-- end of trace

"Local Descriptor Scanner" id=31 idx=0x74 tid=2280 prio=6 alive, sleeping, native_waiting

at java/lang/Thread.sleep(J)V(Native Method)

..

"JDP Stale Descriptor Detector" id=32 idx=0x78 tid=4788 prio=6 alive, sleeping, native_waiting

at java/lang/Thread.sleep(J)V(Native Method)

..

-- end of trace

===== END OF THREAD DUMP ===============


 jrcmd 5176 heap_diagnostics


5176:

Invoked from diagnosticcommand

======== BEGIN OF HEAPDIAGNOSTIC =========================

Total memory in system: 2136891392 bytes

Available physical memory in system: 179638272 bytes

-Xmx (maximal heap size) is 1073741824 bytes

Heapsize: 48463872 bytes

Free heap-memory: 19064600 bytes

--------- Detailed Heap Statistics: ---------

44.3% 3375k    30871   -190k [C

9.8% 745k    31818    -56k java/lang/String

8.5% 645k     5906     +0k java/lang/Class

5.5% 417k     1378     -1k [I

3.8% 292k      237     +0k [B

3.6% 272k    11637    -43k java/util/HashMap$Entry

2.4% 179k     2234    -21k [Ljava/util/HashMap$Entry;

2.3% 171k     2585     -8k [Ljava/lang/Object;

1.4% 103k     2213    -27k java/util/HashMap

1.0% 72k     3114     +0k java/util/Hashtable$Entry

.....

7619kB total ---

--------- End of Detailed Heap Statistics ---

----- Reference Objects statistics separated per class -----

Total Reach Act PrevAct Null

----- ----- --- ------- ----

Soft References:

1456    60   0     971  425 Total for all Soft References

org/eclipse/core/internal/registry/ReferenceMap$SoftRef =>

974    12   0     962    0 Total

962     0   0     962    0 => null

12    12   0       0    0 => org/eclipse/osgi/framework/internal/core/BundleHost

java/lang/ref/SoftReference =>

430     5   0       0  425 Total

425     0   0       0  425 => null

2     2   0       0    0 => [Ljava/lang/reflect/Constructor;

1     1   0       0    0 => org/eclipse/osgi/internal/baseadaptor/DefaultClassLoader

1     1   0       0    0 => java/util/jar/Manifest

1     1   0       0    0 => java/lang/StringCoding$StringDecoder

java/util/ResourceBundle$BundleReference =>

48    40   0       8    0 Total

29    29   0       0    0 => java/util/ResourceBundle$1

11    11   0       0    0 => java/util/PropertyResourceBundle

8     0   0       8    0 => null

sun/security/util/MemoryCache$SoftCacheEntry =>

3     3   0       0    0 Total

3     3   0       0    0 => sun/security/x509/X509CertImpl

sun/misc/SoftCache$ValueCell =>

1     0   0       1    0 Total

1     0   0       1    0 => null

Weak References:

2982  2614   0     173  195 Total for all Weak References

java/lang/ref/WeakReference =>

1705  1510   0       0  195 Total

796   796   0       0    0 => java/lang/String

327   327   0       0    0 => java/lang/Class

....

java/util/WeakHashMap$Entry =>

1130   958   0     172    0 Total

796   796   0       0    0 => java/lang/String

172     0   0     172    0 => null

..

java/util/ResourceBundle$LoaderReference =>

48    48   0       0    0 Total

39    39   0       0    0 => org/eclipse/osgi/internal/baseadaptor/DefaultClassLoader

9     9   0       0    0 => java/util/ResourceBundle$RBClassLoader

java/lang/ThreadLocal$ThreadLocalMap$Entry =>

38    38   0       0    0 Total

20    20   0       0    0 => java/lang/ThreadLocal

11    11   0       0    0 => java/lang/InheritableThreadLocal

4     4   0       0    0 => org/eclipse/ui/internal/UISynchronizer$2

2     2   0       0    0 => sun/misc/FloatingDecimal$1

1     1   0       0    0 => org/eclipse/ui/internal/UISynchronizer$1

org/eclipse/core/internal/runtime/ReferenceHashSet$HashableWeakReference =>

35    35   0       0    0 Total

12    12   0       0    0 => org/eclipse/ui/internal/registry/ViewDescriptor

6     6   0       0    0 => org/eclipse/ui/internal/registry/ActionSetDescriptor

...

com/sun/jmx/mbeanserver/WeakIdentityHashMap$IdentityWeakReference =>

15    15   0       0    0 Total

3     3   0       0    0 => sun/management/MemoryPoolImpl

2     2   0       0    0 => sun/management/GarbageCollectorImpl

1     1   0       0    0 => sun/management/RuntimeImpl

...

com/sun/java/swing/plaf/windows/DesktopProperty$WeakPCL =>

6     6   0       0    0 Total

4     4   0       0    0 => com/sun/java/swing/plaf/windows/WindowsLookAndFeel$TriggerDesktopProperty

1     1   0       0    0 => com/sun/java/swing/plaf/windows/WindowsLookAndFeel$FontDesktopProperty

1     1   0       0    0 => com/sun/java/swing/plaf/windows/WindowsLookAndFeel$WindowsFontProperty

sun/nio/ch/FileChannelImpl$FileLockReference =>

4     4   0       0    0 Total

4     4   0       0    0 => sun/nio/ch/FileLockImpl

javax/swing/plaf/metal/MetalLookAndFeel$AATextListener =>

1     0   0       1    0 Total

1     0   0       1    0 => null

Phantom References:

2     2   0       0    0 Total for all Phantom References

java/lang/ref/PhantomReference =>

2     2   0       0    0 Total

2     2   0       0    0 => java/lang/Object

Cleared Phantom:

8     8   0       0    0 Total for all Cleared Phantom

jrockit/vm/ObjectMonitor =>

8     8   0       0    0 Total

2     2   0       0    0 => org/eclipse/osgi/framework/eventmgr/EventManager$EventThread

1     1   0       0    0 => org/eclipse/core/internal/jobs/WorkerPool

...

Finalizers:

161   161   0       0    0 Total for all Finalizers

68    68   0       0    0 => java/util/zip/ZipFile

44    44   0       0    0 => java/util/zip/Inflater

...

Weak Handles:

8311  8311   0       0    0 Total for all Weak Handles

6052  6052   0       0    0 => org/eclipse/osgi/internal/baseadaptor/DefaultClassLoader

1397  1397   0       0    0 => java/lang/String

594   594   0       0    0 => org/eclipse/equinox/launcher/Main$StartupClassLoader

..

Soft reachable referents not used for at least 201.708 s cleared.

3 SoftReferences was soft alive but not reachable (when found by the GC),

0 was both soft alive and reachable, and 1453 was not soft alive.

----- End of Reference Objects statistics -----

Dark matter: 509525593 bytes

Heap size is not locked

======== END OF HEAPDIAGNOSTIC ===========================


 jrcmd 5176 oom_diagnostics


similar to heap diagnostics


 jrcmd 5176 version


5176:

Oracle JRockit(R) build R28.1.0-123-138454-1.6.0_20-20101014-1351-windows-ia32, compiled mode

GC mode: Garbage collection optimized for short pausetimes, strategy: singleconcon


 jrcmd 5176 print_memusage


5176:

Total mapped                  1242224KB           (reserved=1074256KB)

-              Java heap      1048576KB           (reserved=1001248KB)

-              GC tables        35084KB

-          Thread stacks        10752KB           (#threads=24)

-          Compiled code         3968KB           (used=3812KB)

-               Internal          968KB

-                     OS        43488KB

-                  Other        70588KB

-        Java class data        27776KB           (malloced=27745KB #32965 in 5906 classes)

- Native memory tracking         1024KB           (malloced=361KB #8)


 jrcmd 5176 print_vmflags


5176:

Global:

UnlockDiagnosticVMOptions = false (default, writeable)

UnlockInternalVMOptions = false (default)

Class:

FailOverToOldVerifier = true (default, writeable)

UseVerifierClassCache = true (default)

UseClassGC = true (default)

Threads:

UseThreadPriorities = false (default)

DeferThrSuspendLoopCount = 4000 (default, writeable)

SafepointSpinBeforeYield = 2000 (default, writeable)

UseCompilerSafepoints = true (default)

DeferPollingPageLoopCount = -1 (default)

UseMembarForTransitions = false (default)

UseNativeLockProfiling = false (default)

JNI:

CheckJNICalls = false (default)

AbortOnFailedJNICheck = true (default)

ErrorOnFailedJNICheck = false (default)

JDK:

UseNewHashFunction = false (default)

TreeMapNodeSize = 64 (default)

MaxDirectMemorySize = 0 (default)

UseLazyStackTraces = true (default)

ShowInternalMethodsInStackTrace = false (default, writeable)

OS:

ReduceSignalUsage = false (default)

MaxRecvBufferSize = 65536 (default)

MaxLargePageSize = 0 (default)

GC:

UseLowAddressForHeap = true (default)

UseLargePagesForHeap = false (default)

ForceLargePagesForHeap = false (default)

CompressedRefs = false (default)

InitialHeapSize = 0 (default)

MaxHeapSize = 0 (default)

GCTimeRatio = 19 (default)

GCTimePercentage = 0.000000 (default)

GCTrigger = 0 (default)

ForceEarlyOC = true (default)

ForceEarlyOCMaxPercentage = 5.000000 (default)

ForceYCOnLargeAllocationFailed = false (default)

UseNurseryEvacuation = false (default)

DisableEvacuationToNursery = false (default)

SemiRefPostponedPacketSize = 492 (default)

SemiRefPrefetchDistance = 0 (default)

FinalHandleParallelThreshold = 800 (default)

FinalHandlePacketSize = 200 (default)

MaximumNurseryPercentage = 95 (default)

AllowYCDuringOC = true (default)

YcAlignAll = false (default)

YcAlignMaxSpill = 40 (default)

FullSystemGC = false (default)

AllowSystemGC = true (default)

GcCardTableParts = 1024 (default)

GcBalancePrefetchDistance = 4 (default)

GcBalancePacketSize = 493 (default)

NumGenConPrecleaningIterations = 3 (default)

AllowEmergencyParSweep = true (default)

TlaWasteLimit = 2K (set by runtime)

TlaMinSize = 2K (set by runtime)

TlaPreferredSize = 16K (set by runtime)

GC::Compaction:

UseFullCompaction = false (default)

InternalCompactionPercentage = -1.000000 (default)

ExternalCompactionPercentage = -1.000000 (default)

InitialCompactionPercentage = -1.000000 (default)

UseCompaction = true (default)

UseAbortableCompaction = false (default)

NumCompactionHeapParts = 4096 (default)

InitialExternalReservedHeap = 4M (default)

UseFixedExternalReservedHeap = false (default)

MaxCompactionReferences = 0 (default)

MaxCompactionReferencesPerObject = 0 (default)

InternalCompactionParts = -1 (default)

ExternalCompactionParts = -1 (default)

Object allocation:

UseAllocPrefetch = true (default)

RedoAllocPrefetch = true (default)

AllocPrefetchLineLength = 64 (default)

AllocPrefetchDistance = 448 (default)

AllocChunkSize = 512 (default)

Javalock:

UseLockProfiling = false (default)

ThinLockContendedSpinCount = 65 (default)

ThinLockContendedPollCount = 50 (default)

ThinLockConvertToFatThreshold = 240 (default)

FatLockContendedSpinCount = 65 (default)

FatLockContendedPollCount = 50 (default)

MonitorContendedSpinCount = 50 (default)

MonitorContendedPollCount = 20 (default)

UseFatLockDeflation = true (default)

FatLockDeflationThreshold = 50 (default)

UseLockQueueLength = true (default)

UseFatSpin = true (default)

UseAdaptiveFatSpin = false (default)

UseThreadContentionMonitoring = true (default)

JavaLock::LazyUnlocking:

UseLazyUnlocking = true (default)

UseLazyUnlockingInJIT = true (default)

UseLazyUnlockingClassBan = true (default)

UseLazyUnlockingTransferClassBan = true (default)

JFR:

FlightRecorder = true (default)

FlightRecorderOptions = (null) (default)

StartFlightRecording = (null) (default)

Code memory:

CodeBlockAbsorbtionSize = 16 (default)

FreeEmptyCodeBlocks = true (default)

UseLargePagesForCode = false (default)

MaxCodeMemory = 0 (default)

ReserveCodeMemory = false (default)

UseCodeGC = true (default)

CodeGCThreshold = 0 (default)

CodeGCReclaimThreshold = 0 (default)

CodeGCUseReclaim = true (default)

Compiler broker:

MaxOptQueueLength = 0 (default)

OptThreads = 1 (default)

JITThreads = 1 (default)

JITThreadPrio = 5 (default)

OptThreadPrio = 5 (default)

DisableOptsAfter = -1 (default)

Compiler:

PreOpt = false (default)

UseCallProfiling = false (default)

StrictFP = false (default)

CheckStacks = false (default)

DevirtualizeAlways = false (default)

UseStringCache = false (default)

MethodCodeAlignment = 32 (default)

UseInlineObjectAlloc = true (default)

UseOldLockMatching = false (default)

JVMTI:

JavaDebug = false (default)

Management:

DisableAttachMechanism = false (default)

CrashOnOutOfMemoryError = false (default, writeable)

ExitOnOutOfMemoryError = false (default, writeable)

ExitOnOutOfMemoryErrorExitCode = 51 (default, writeable)

HeapDiagnosticsOnOutOfMemoryError = false (default, writeable)

HeapDiagnosticsPath = (null) (default, writeable)

HeapDumpOnOutOfMemoryError = false (default, writeable)

HeapDumpOnCtrlBreak = false (default)

HeapDumpPath = (null) (default, writeable)

SegmentedHeapDumpThreshold = 2G (default, writeable)

HeapDumpSegmentSize = 1G (default)

StartMemleakOnPort = 0 (default, writeable)

FlightRecordingDumpOnUnhandledException = false (default, writeable)

FlightRecordingDumpPath = (null) (default, writeable)

Runtime:

AbortOnCrash = false (default, writeable)

DumpOnCrash = true (default, writeable)

CoreOnCrash = true (default, writeable)

WaitOnCrash = false (default, writeable)

AbortOnAssert = true (default, writeable)

CrashOnAssert = false (default, writeable)

WaitOnAssert = false (default, writeable)

NumaMemoryPolicy = (null) (default)

BindToNumaNodes = (null) (default)

BindToCPUs = (null) (default)

UseFastTime = true (default)

UseJNIPinning = true (default)

JRockit – a quick view


What is Jrockit JVM?

Is a high performance JVM developed to ensure reliability, scalability, manageability? It’s an enterprise JVM optimized for inter architectures

How machine code is generated by JVM?

Operations stage – JIT compilation – less effective method compilation when the method is called for the first time

Data Structures stage – Thread monitoring – which all methods are frequently called and looking for hot spots

Transformation stage – Code Optimization – recompiles the commonly executed method again efficiently

How threads are used by the JVM?

Each java threads has a stack to store runtime data. -Xss to set the statck size of the thread object for java application, the default for jvm is 256KB

What are the types of Locks?

Thin lock – thread B spins for short time if the lock is acquired by thread A

Fat lock – if thin lock spins for long time, then the CPU time is utilized by other resources by inflating thin lock to fat lock

Recursive lock – synchronized call gets called by itself

Lazy lock – critical section is checked for this lock by the thread

What do you mean by Lock Chains?

Lock chain – A holds lock1 that B also needs, B holds lock 2 that C needs

Open chain – A depends on B, B depends on C and so on. If Long Open chain then the CPU time is wasted in waiting for locks

Deadlock chain – A depends B, B depends on C, C depends on A

Blocked chain – A depends on B, C depends on B, B depends on A

How memory is managed by JVM?

Most common assumption is that an object is most likely to die shortly after it was created: called infant mortality. Objects that are referenced are called as live objects .The process of finding and freeing the space used by these objects are called as Garbage collections

Heap contains two generations. [Nursery or Young] and Old Spaces

TLA [Thread local Area] – free memory chunks from the heap for java threads for exclusive use

Nursery/young’s space – new objects are allocated here – Eden space. Nursery has kept area for current object allocation before young’s collection

Survivor space – objects survived GC of Eden space

Tenured space – objects existed sometime in survivor space are moved to tenured or old space

Old space – after young’s collection objects are moved here

Perm Space – Area of the VM that is used to store the data structures and class information’s.

-XX:MaxPermSize is used to get rid of outofmemoryerror

While promotion if the memory is less than they are stored within young’s space called fragmented nursery – promotion failure

Fragmentation – when the memory is freed the free space may appear in small chunks in many area so that there might not be a contiguous area for allocation of large objects

Compaction – compressing the live objects together and completely reclaiming the memory

What are the basic GC algorithms?

Reference Counting

Mark and Sweep

Compacting

Copying

What are different types of collections?

Serial collection – only one CPU is used for GC, -XX:+UseSerialGC

Parallel Collection – GC is split between different CPU and executed simultaneously, -XX:+UseParallelGC

Stop the world collection – the entire application is completely suspended during the collection

Concurrent collection – one or more GC tasks are done concurrently with few stop the world pauses

Compacting collection – this will compact the entire free space by compressing the live objects

Non compacting collection – will not compact leads to fragmentation

Copying collection – copies the live objects to different area

Parallel Compacting Collection – -XX: +UseParallelOldGC

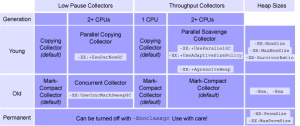
What are the collectors used?


What are all the performance metrics?

Throughput – % of time not spent in GC

GC overhead – % of time spent in GC

Pause time – unresponsive because of GC

Frequency of collection – how often GC is performed

Memory Footprints – measure of heap size

Promptness – the time between objects GC and memory becomes available

CPU usages – CPU usage in GC

What are the tools to evaluate GC performance?

-XX:+PrintGC

-XX:+PrintGCDetails

-XX:+PrintGCTimeStamps

-verbose:gc

-Xloggc:gc.log

What is Basic GC tuning?

Throughput goal – -XX:GCTimeRatio, total time to be spent on GC

Maximum Pause Time Goal – -XX:MaxGCPauseMillis, indication for collector for pause time

-XX:ParallelGCThreads – number of CPU

Footprint goal

What are Advance GC Tuning?

-Xms – starting heap size

Xmx – maximum heap size

-XX:MinHeapFreeRatio – 40 – proportion of free space to expand

-XX:MaxHeapFreeRatio – 70 – proportion of free space to shrink

-XX:NewSize – intial size of new young generation [eden + survivor 1 + survivor 2]

-XX:MaxNewSize – maximum young size

-XX:NewRatio – ratio between young and tenured size[old]

-XX:SurvivorRatio – ratio between each survivor and eden

-XX:TargetSurvivorRatio – ratio between each survivor and eden after GC

-XX:Permsize – starting permanent generation

-XX:MaxPermSize – max size of permanent generation

-XX:+DisableExplicitGC – disable System.gc()

-XX:+ScavengeBeforeFullGC – perform minor before major collection

-XX:+UseGCOverheadLimit – if 98% of CPU time is spent on GC, then throws OutOfMemoryError